⚪ ️ 3.5 Watch how the content is served over the network
✅ Do: Apply some active monitor that ensures the page load under real network is optimized - this includes any UX concern like slow page load or un-minified bundle. The inspection tools market is no short: basic tools like pingdom, AWS CloudWatch, gcp StackDriver can be easily configured to watch whether the server is alive and response under a reasonable SLA. This only scratches the surface of what might get wrong, hence it’s preferable to opt for tools that specialize in frontend (e.g. lighthouse, pagespeed) and perform richer analysis. The focus should be on symptoms, metrics that directly affect the UX, like page load time, meaningful paint, time until the page gets interactive (TTI). On top of that, one may also watch for technical causes like ensuring the content is compressed, time to the first byte, optimize images, ensuring reasonable DOM size, SSL and many others. It’s advisable to have these rich monitors both during development, as part of the CI and most important - 24x7 over the production’s servers/CDN
❌ Otherwise: It must be disappointing to realize that after such great care for crafting a UI, 100% functional tests passing and sophisticated bundling - the UX is horrible and slow due to CDN misconfiguration
✏ Code Examples
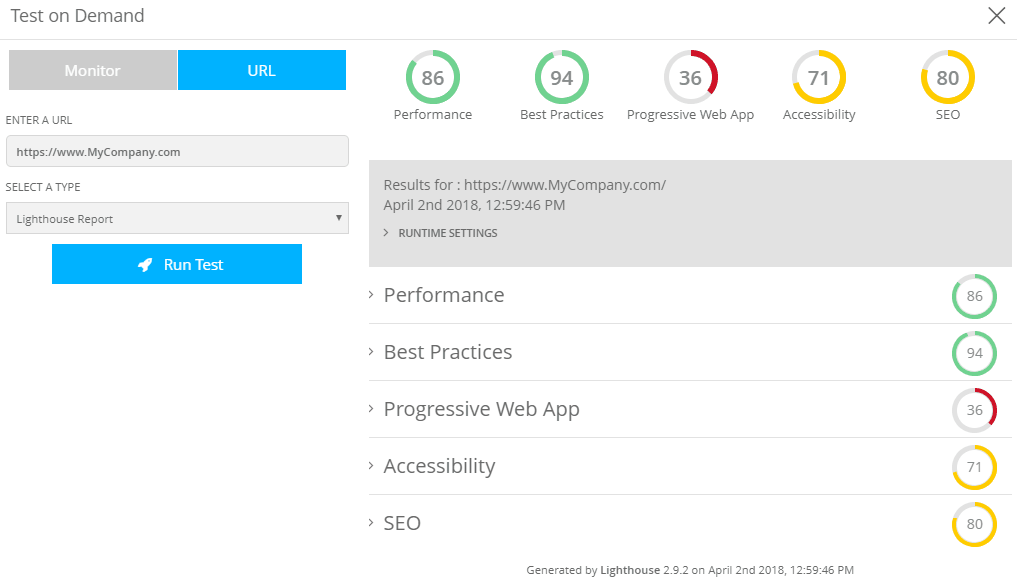
:clap: Doing It Right Example: Lighthouse page load inspection report

